 By Craig Larmer, Consulting Director at Stellar
New Zealanders have a proud history of Do It Yourself. It probably stems from being isolated from other countries and not having the patience to wait for, or the willingness to purchase, expensive imported equipment.
So we shouldn’t be too surprised that self-service visual analytics tools such as Tableau, Qlik and Power BI have transformed how data is used by New Zealand businesses. At Stellar, we’re helping many of New Zealand’s best-known companies take a DIY approach to data, enabling their staff and managers to get the information they need to make better decisions, faster.
With self-service analytics, business users can generate the answers they need in a way that’s fast, repeatable and reliable, without being forced to wait for an IT department to deliver a solution. Not only is this approach quicker, it eliminates the potentially painful process of translating business requirements into a technical solution. IT serves up the data and the business takes it from there.
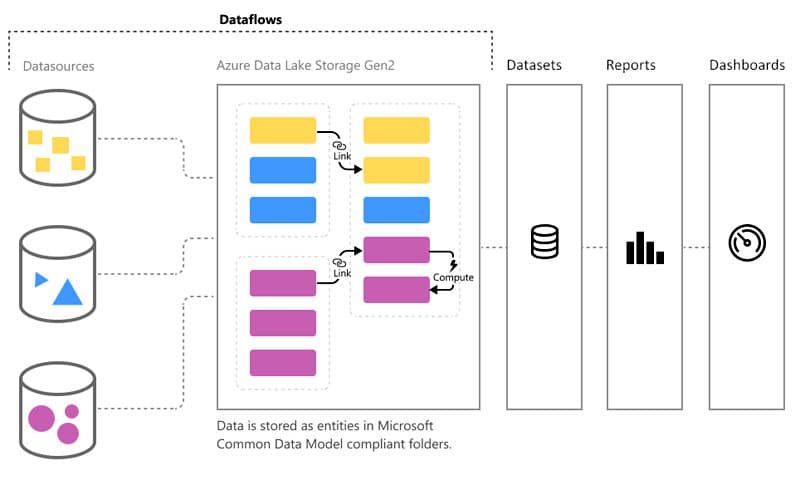
Going even further, the latest developments in these tools let business users prepare the data without involving IT at all. Users can merge and refine raw data to create new datasets, then use these datasets in their own reports or make them available to colleagues to use in other reports. Have a look at recently released products such as Tableau Prep, Power BI Dataflows or Qlik Data Catalyst for examples.
To be fair, the original visual analytics tools all had some level of data prep in them, but it was often tightly bound to a particular report. So if you wanted to re-use that processed dataset in multiple reports you’d have to copy and paste all of the rules and formulas associated with preparing that data.
Of course, once you have more than one copy of the rules it’s easy for one set to change and suddenly you’re dealing with slightly different datasets. The copying and changing continues – until it’s a complete mess!
That’s an important difference with the new tools. They separate the data prep from the reports so that the dataset that gets created can easily be used in multiple reports without having multiple copies of the rules. You can then alter the data preparation processes in one place, knowing that all the downstream reports will reflect the changes.
These tools can’t do everything a data professional can with ETL routines and custom code, but the ability to get to an 80% solution in 20% of the time and effort cannot be ignored. If you start there and take an iterative approach, you may find that the final 20% isn’t actually needed – especially if it’s going to take weeks or months to get that request in front of your data professional.
Managing risk
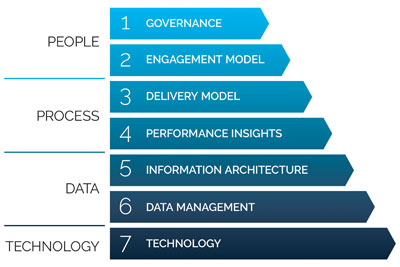 Even with these latest tools you can still end up with people creating and sharing data in all directions. Data governance remains vital to avoiding duplicated and redundant effort – and in our consulting work we address it as part of Data Management in Stellar’s 7 Essentials of BI Success.
Another way to reduce the chances of having multiple versions of data is to adopt a data catalogue approach. Data catalogues help business users find and understand the data that’s available to them. Quite often business users can contribute to the data catalogue so, over time, knowledge of what’s available improves and business users can get more answers themselves.
Also look out for tools like Domo that wrap all of this self-service functionality into one integrated package.
If you’re building a data platform for your organisation make sure you give the business the tools they need so that when they ask for more data you can tell them to ‘Do It Yourself!’
Want to learn more about DIY data? Feel free to contact Stellar.