Every Data & Analytics implementation faces, from time to time, the challenge to add extra information into the current solution or service different users’ views of the business. Sometimes those requests can become a battle for resources or disrupt a work plan if not addressed and appropriately controlled.
Scenario
A Global Store Chain has multiple stores around the world. Marketing, Sales and Billing Teams have particular ways to see the markets as different general managers are assigned for each geographic region.
Another issue is that legacy systems can’t store those different groupings and hierarchies. Global Markets Manager Paula asked her principal business analyst, Lucy, if it is possible to visualise 2021 sales based on the Sales Team structure. Using Oracle Analytics Cloud (OAC), data analysts can create reports with those different views of regions by just adding a new data set.
Examples
Note. This example is not the same as using a group on OAC Answers but using an external data set that can be used in visualisations and subject areas.
Lucy creates an excel data set listing the markets and corresponding managers.
| VP of Sales | Market |
| John | APAC |
| Angelo | Africa |
| Brad | Canada |
| John | EMEA |
| Frans | EU |
| Angelo | LATAM |
| Brad | US |
Lucy can now start by adding this new dataset to the OAC.
- Lucy log into OAC
- Creates a new dataset
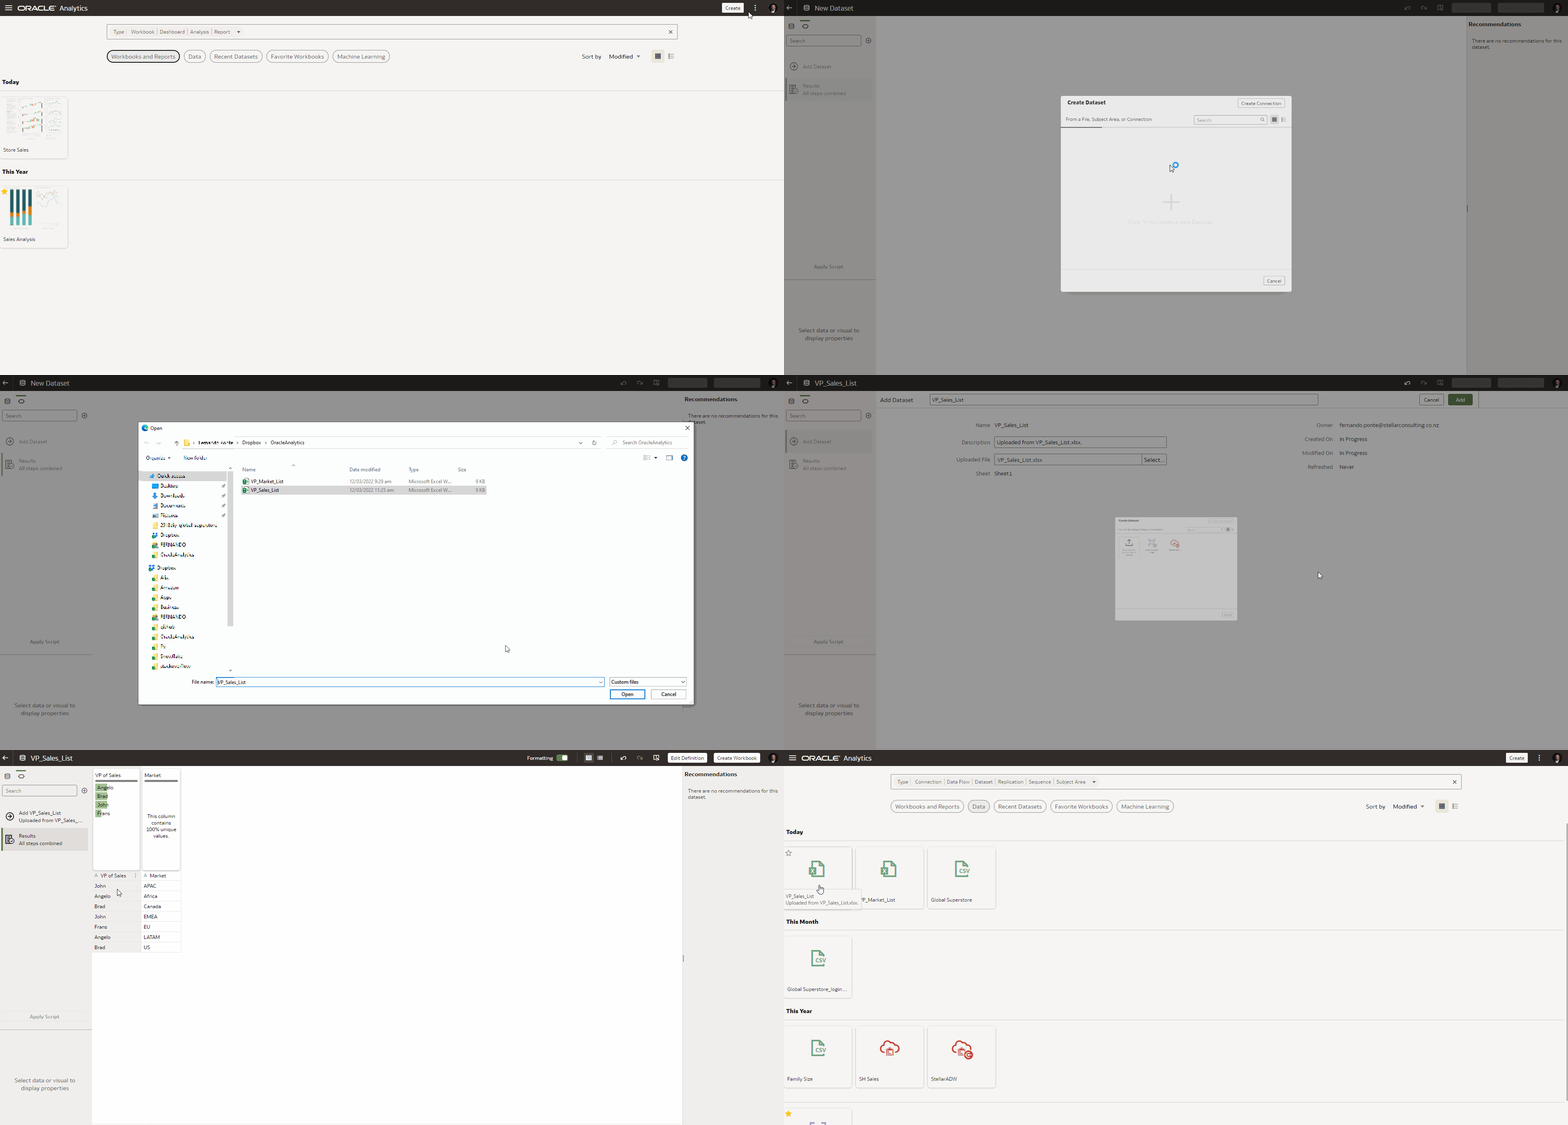
- Lucy then opens the existing visualisation and creates a new Canvas to report the recently added data set.
- She adds the new Data set and joins them by Markets (the correct markets attribute).
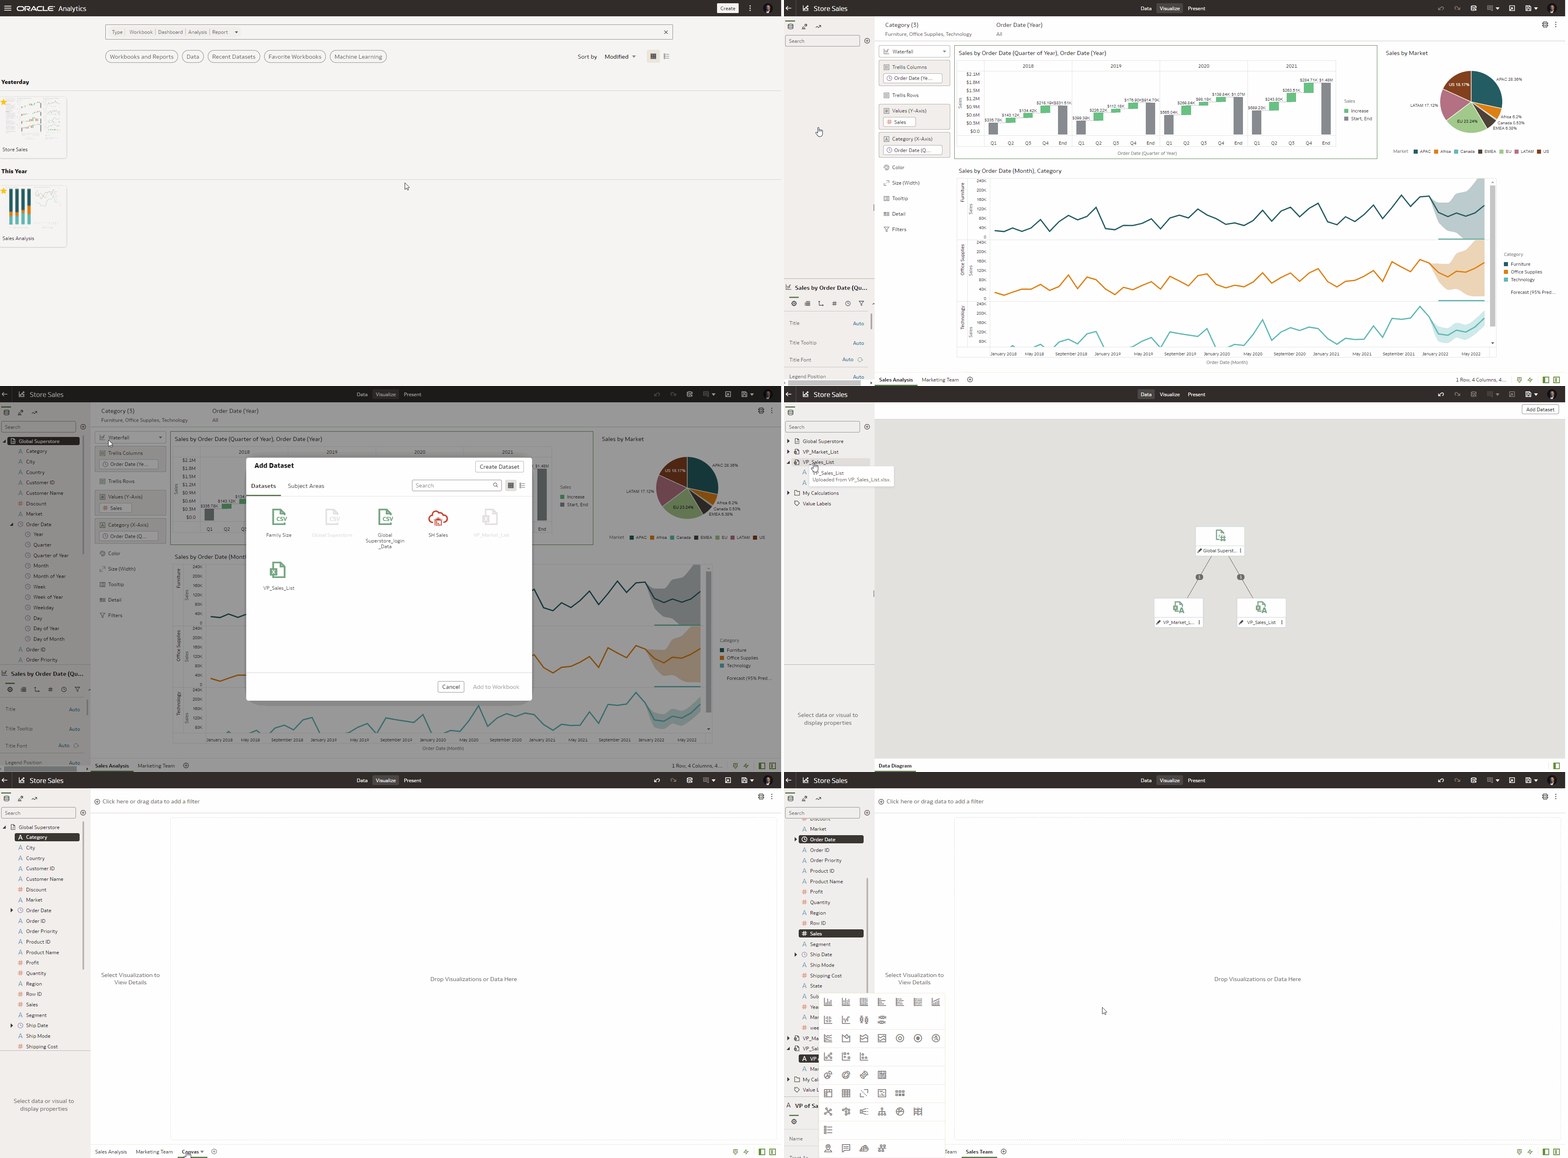
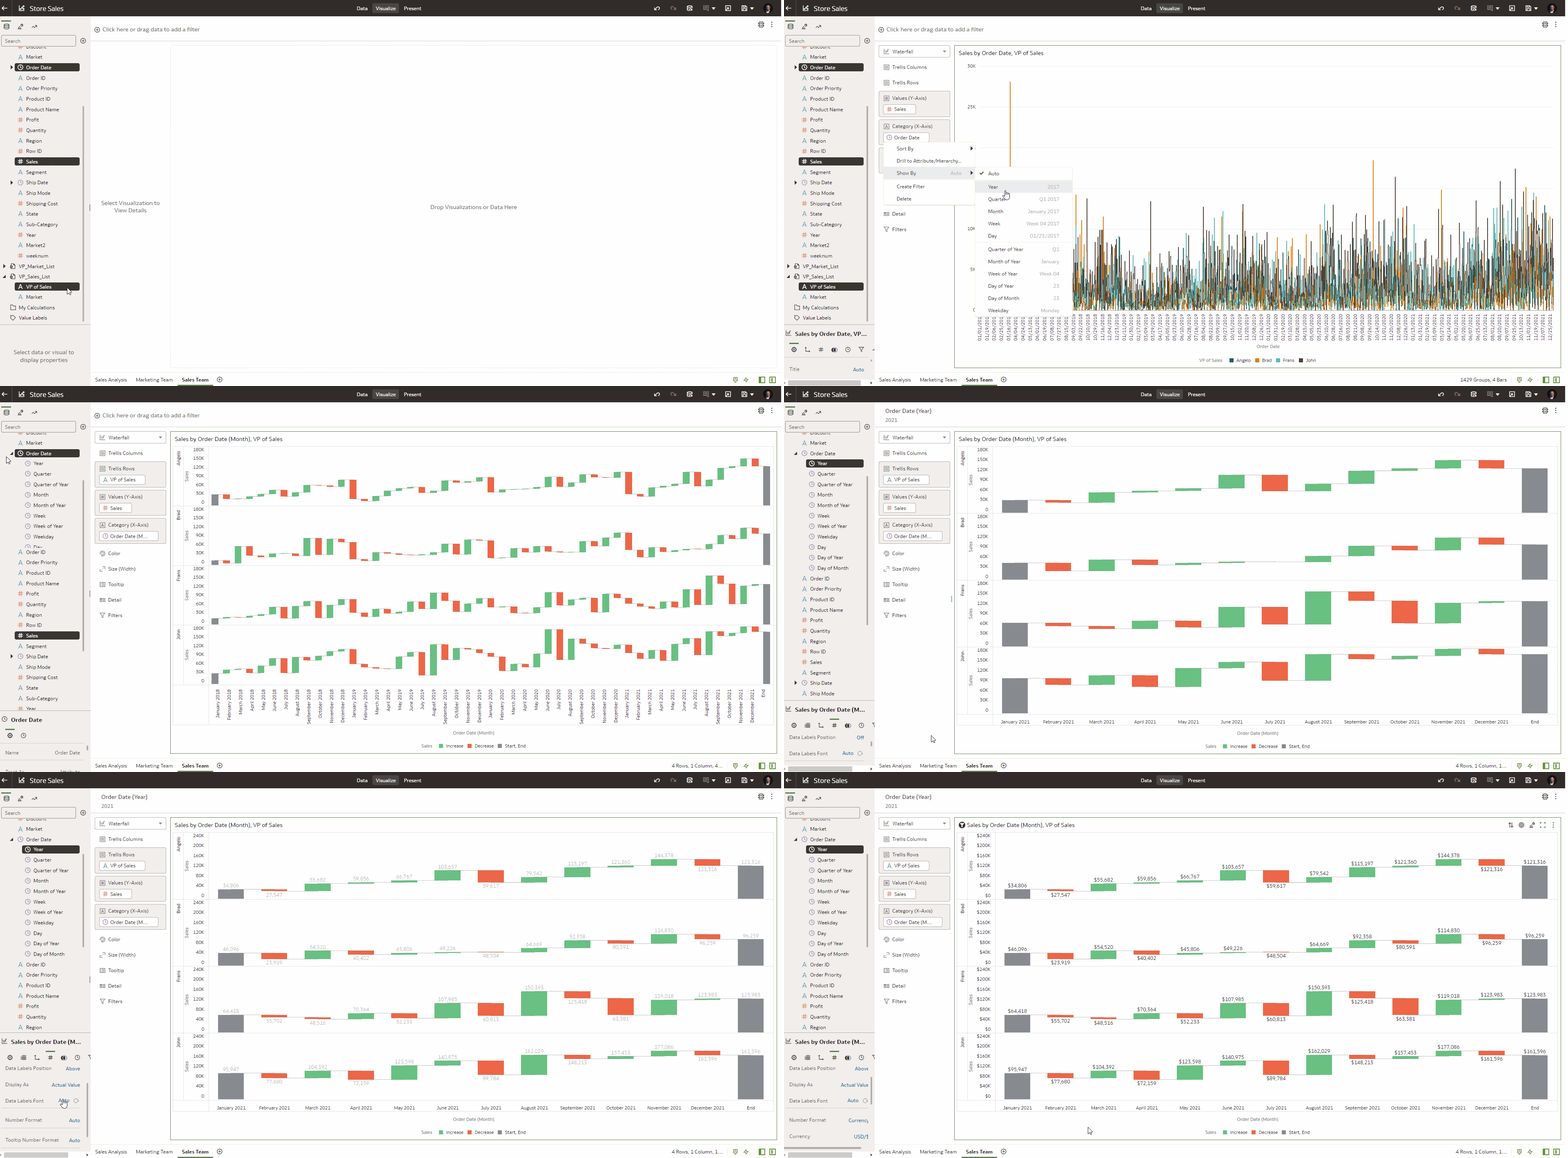
- She then creates a Waterfall visualisation showing the evolution of Sales per Manager in 2021.
- Lucy also adds a narrative analysis that provides insights into the data. She duplicates the current narrative and orders the month and manager’s visualisation attributes.
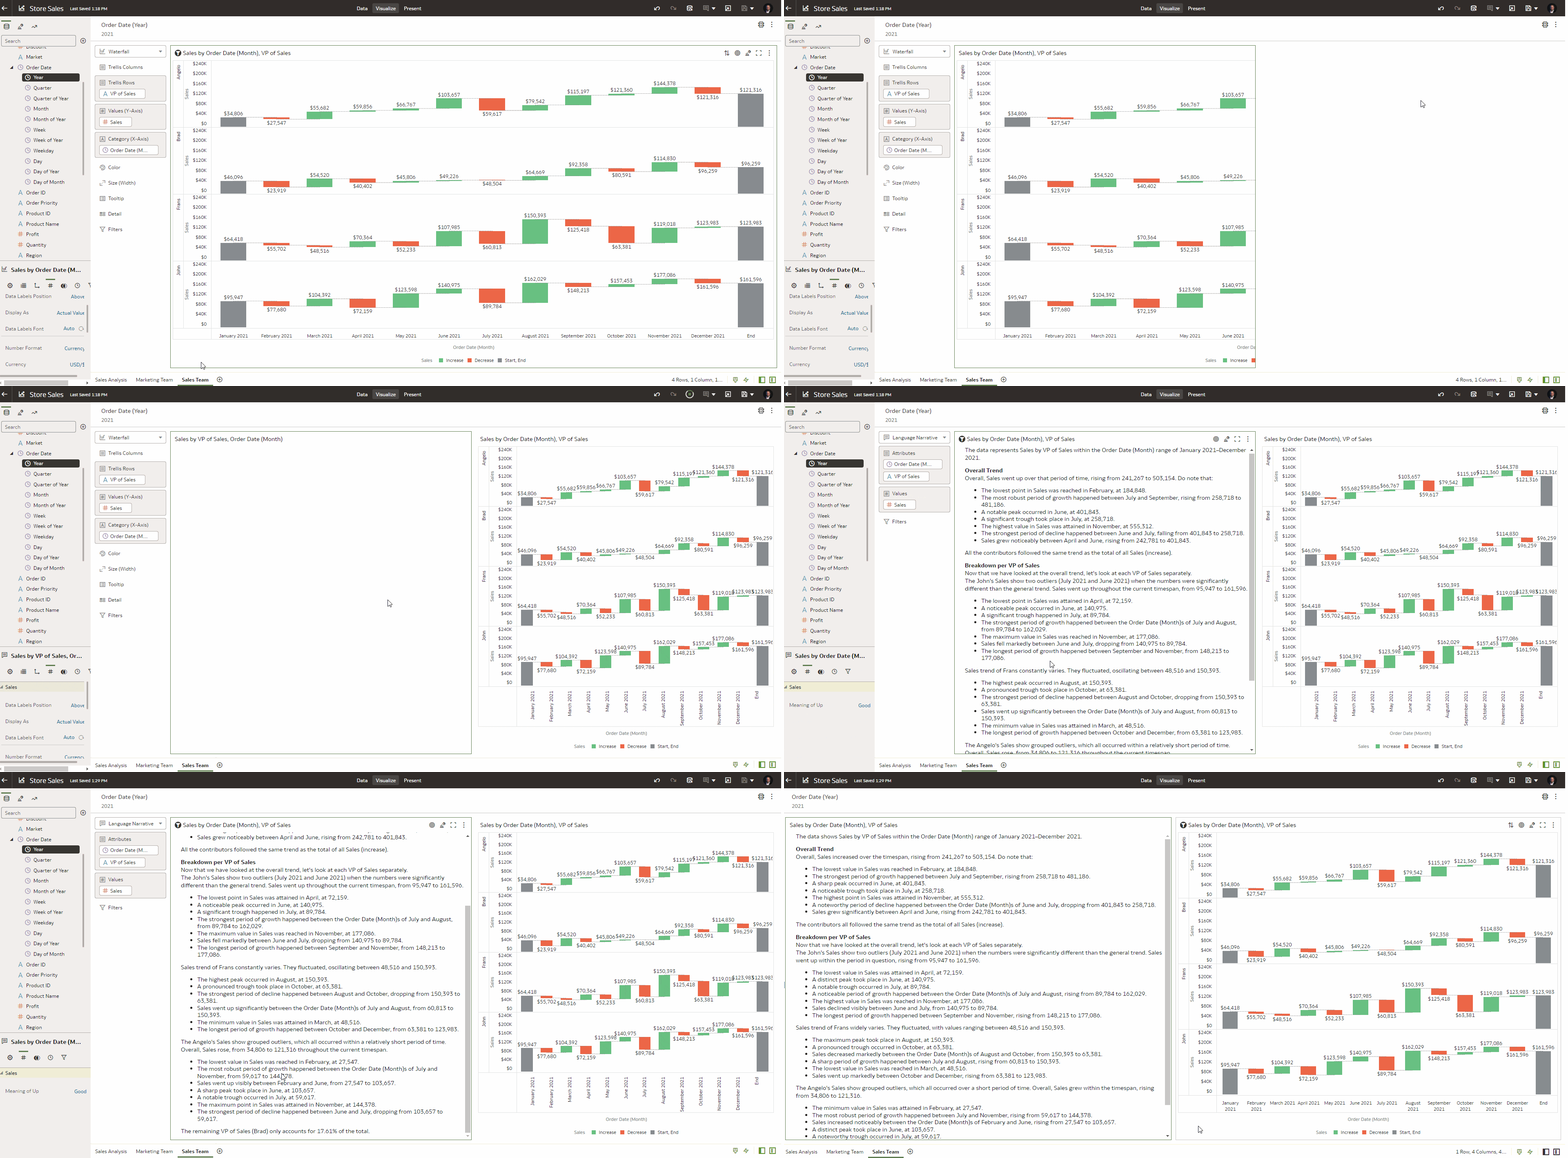
- Lucy then presents the result to Paula as a new canvas in the Sales Dashboard visualisation and add comments.
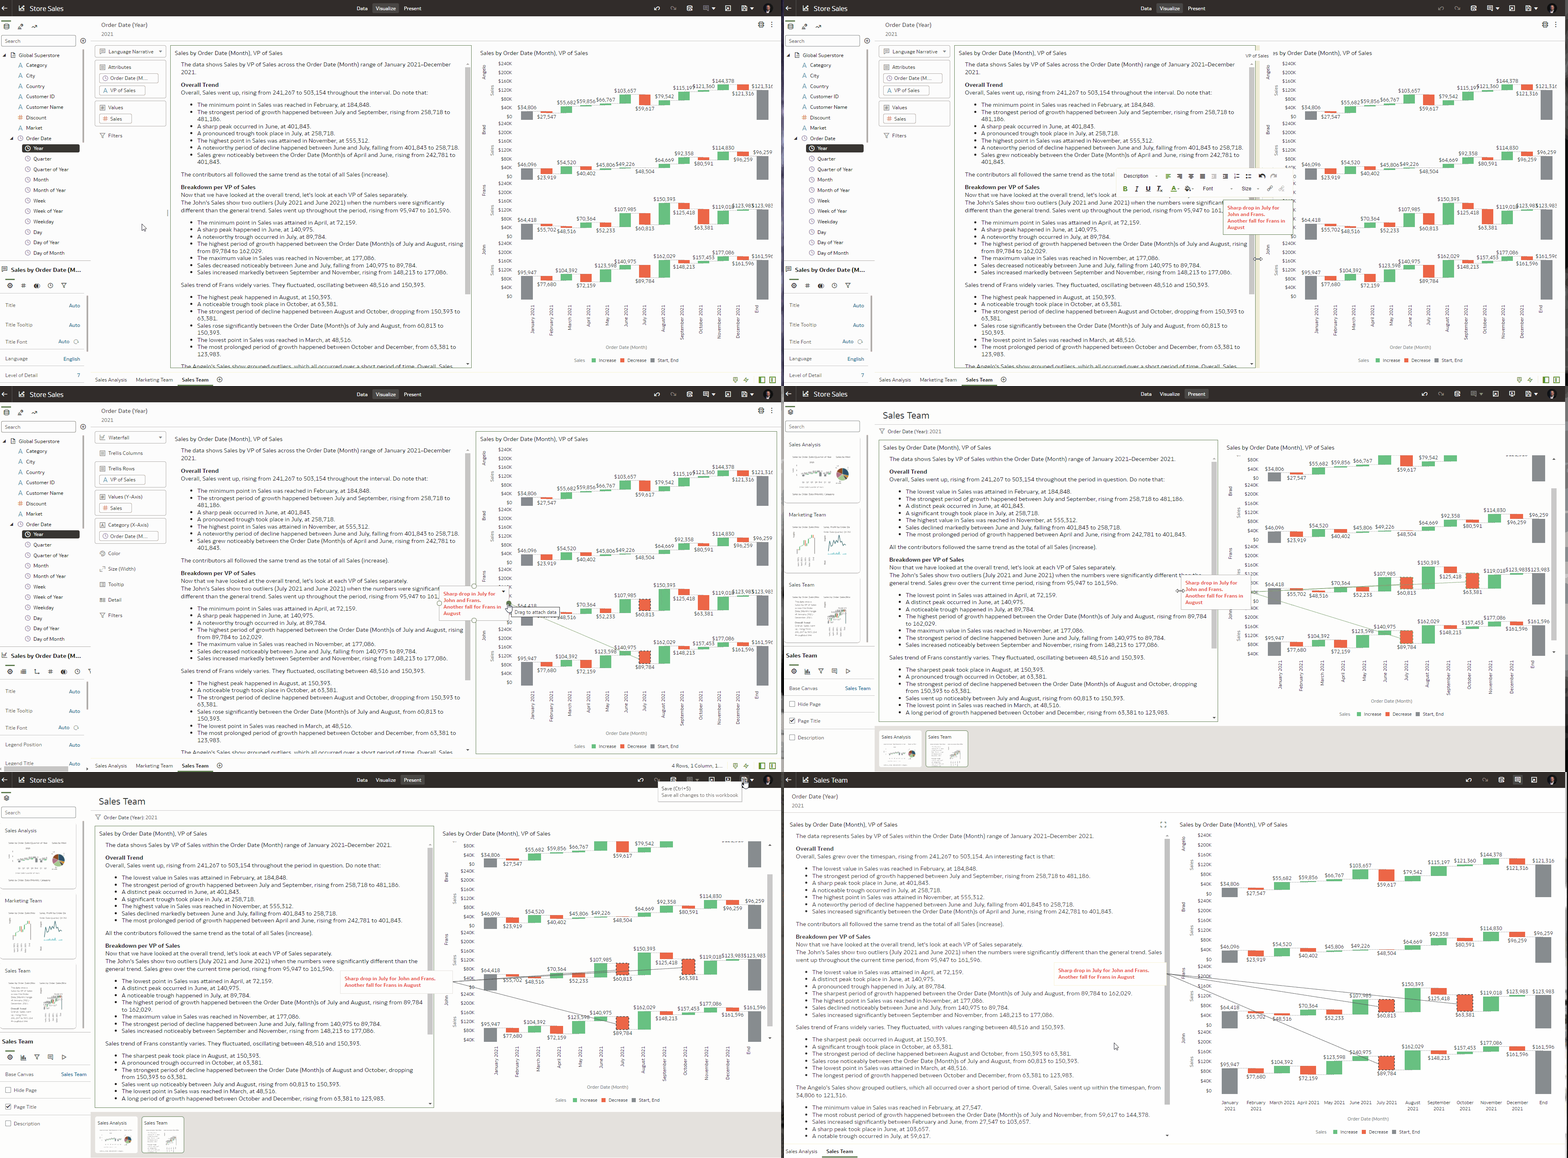
Now Paula has a good view of the Sales in 2021 based on her own Sales Team structure. She just needed to define the structure and ask her business analyst, Lucy, to build the visualisation.
Paula’s Sales Team Structure can now be shared with other people or broken down on Regional Managers if the country data is included. The same structure can also be modified or expanded by uploading an updated file to OAC with no need to change the Sales subject area structure or involvement of data engineers.
Many ways to achieve a similar output
There are many ways to achieve a similar output. There is the possibility of creating a data flow and reading the Excel file from a network folder.
It is possible to create an application on Oracle Apex and give access to Lucy, but this is the most straightforward path to empower the business user with a complete self-service way to enhance analytics data with its view of the business.


