
By Shane Kavanagh, GM – Consulting at Stellar
Data and Analytics solutions enable organisations to discover opportunities for competitive advantage, but too often the most valuable opportunities are not followed up.
Armed with powerful analytics tools, organisations can find themselves drowning in reports while lacking the fundamental processes to help them set priorities and decide where, when and how to act.
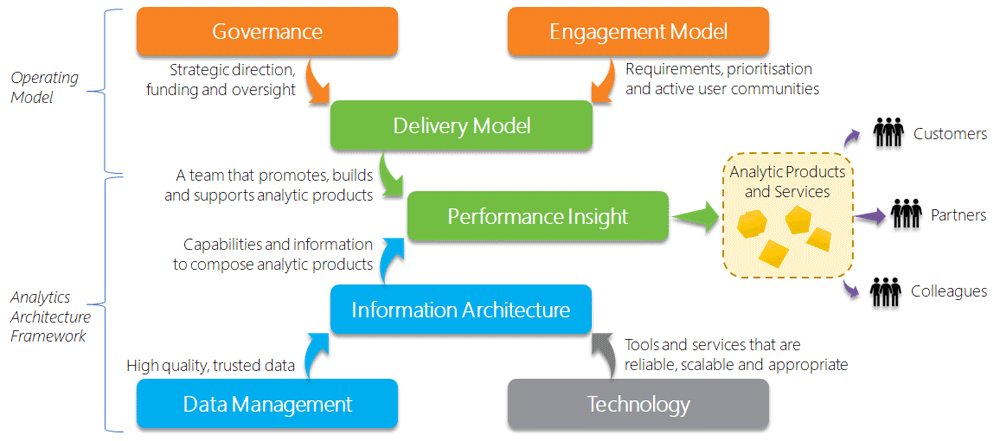
At Stellar, we believe organisations need a high-performing Delivery Model, built with data that is well-governed, high-quality and understood by everyone.
This concept is shown in the diagram below and is composed of the Operating Model and the Analytics Architecture Framework aligned with Stellar’s Seven Essentials of Success.
Cutting out the clutter

A skilled analytics team will simplify and reduce the available data to just the essential pieces of actionable insight, using a range of methodologies to get to the root of the problem or to produce the required analysis.
No matter which toolset is being used, inquisition and smart Root-Cause Analysis is just one of many problem-solving process.
Once you identify the outlier information and assess the cause, the next step is implementing a repeatable solution and conducting regular checks to ensure you’re holding on to the gain and achieving sustainable, continuous improvements.
What can we do, if all we currently get is reporting?
McKinsey notes that unlocking the full benefits of analytics depends on three factors:
- Building a culture that welcomes analytics and data-driven decision making.
- Ensuring senior management is involved in the deployment and use of analytics tools.
- Committing to excellence by promoting use of analytics throughout the business.
By releasing and testing new iterations of products frequently, taking feedback and refining, a strategy of gradual improvement can yield impressive results.
One easy way to get started in the insights journey is to borrow some of the more basic techniques from the manufacturing world. The techniques employed differ greatly depending on the product being analysed, but the most commonly employed methods for narrowing data into analysis are shown below;
1. Pareto Chart
Pareto charts are one of the seven basic tools of quality described by quality pioneer Joseph Juran. Pareto charts are based on Pareto’s law, also called the 80/20 rule, which says that 20% of inputs drive 80% of results. In its simplest terms – look at the outliers and repeat or replace.
2. The 5 Whys
The basic idea is that each time you ask “why?” the answer becomes the basis of the next “why?”. It’s a useful tool for problems where you don’t need advanced statistics. You don’t necessarily want to use it for complex problems, but it helps for simple process measurements and change.
3. Fishbone Diagram
A fishbone diagram sorts possible causes into various categories that branch off from the original problem. Also called a Cause-and-Effect or Ishakawa diagram, a fishbone diagram may have multiple sub-causes branching off each identified category.
4. Scatter Diagram
A scatter plot or scatter diagram uses pairs of data points to help uncover relationships between variables. A scatter plot is a quantitative method for determining whether two variables are correlated, such as testing potential causes identified in your fishbone diagram. A common use of scatter plots is to examine fluctuations in demand for services, based on price.
5. Failure Mode and Effects Analysis (FMEA)
Failure Mode and Effects Analysis (FMEA) is a method used during product (or process) design to explore potential defects or failures. An FMEA chart outlines:
- Potential failures, consequences and causes.
- Current controls to prevent each type of failure.
- Severity (S), occurrence (O) and detection (D) ratings that allow you to calculate a risk priority number (RPN) for determining further actions.
Still looking for those elusive insights?
If you’ve tried the quick suggestions above, but you’re seeing these symptoms:
- There has been relatively slow velocity in insights, and increased backwards-facing data development with little or no insight.
- There has been more report maintenance work required than envisioned.
- Insights are on transactional data with limited integration of other data sources, especially external.
- The Data and Analytics team are lacking capacity for ad-hoc insight work
…then maybe it’s time to get an external party in, to see if there is room for improvement.
Feel free to contact me with your business insight requirements.
About Stellar
Stellar Consulting Group works with many of New Zealand’s most respected organisations, helping them optimise their operations, get closer to their customers, and use data to create innovative products and services. Our team of dedicated consultants – the largest in the country – has the expertise to help businesses thrive.
We’ll work with you to identify opportunities and create an operating model and data strategy that will optimise delivering insight-based decision making. We partner with the leading vendors so we can also advise you on the components and build the system that’s just right for you and your team.
First published 15 October 2019