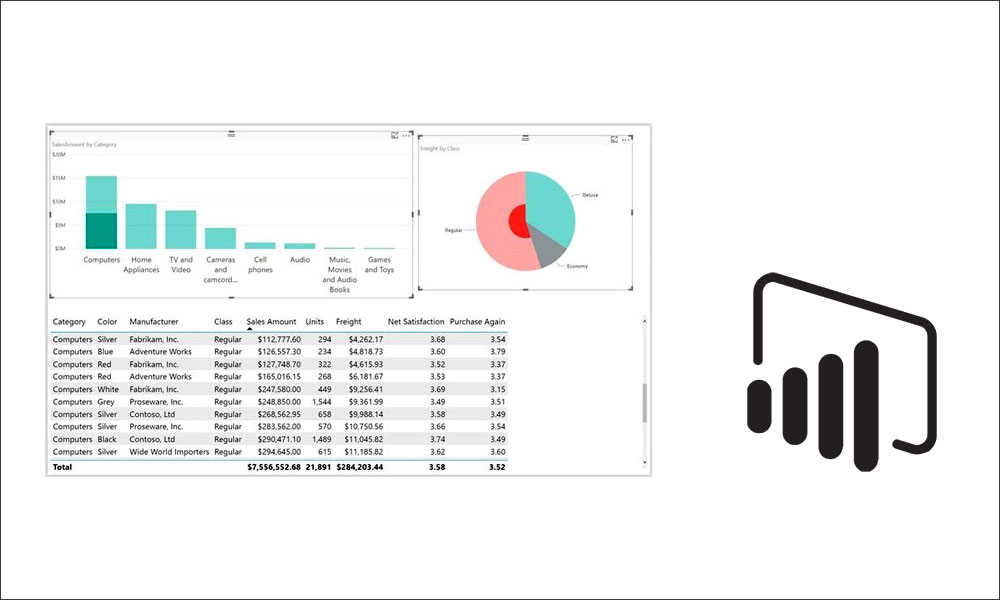
 The February update for Power BI Desktop includes some exciting features that users have been requesting, including the ability to multi-select data points across multiple charts. With a simple ctrl+click on data points in multiple charts you can now apply cross filters to your entire report.
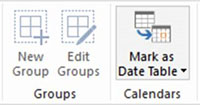
Power BI will now allow you to mark a table as a date table. This will enable date hierarchies and time intelligence for the selected table.
Other improvements on the reporting side include the ability to “synch” slicers so they apply to multiple pages, and a new search box to easily find formatting and analytics features.
Power BI admins get the ability to share Custom Visuals within their organisation.
“Often, these visuals are specific to the organisation’s needs and the way that it runs its business,” says Microsoft. “The organisation typically doesn’t want to publish the visual to the public. Nevertheless, there is a real need to get those visuals into the hands of data analysts inside the organisation, the ones that build and maintain the analytics reports and dashboards. It’s especially important that it’s easy for them to discover the appropriate visuals and to know they don’t need to maintain and update these visuals to use them.”
There are many more new features in Power BI Desktop this month. To find out more, check out the video below, or visit the Power BI blog.