
Crombie Lockwood was acquired in 2014 by Gallagher, the world’s fourth-largest insurance broker.
In 2018, insurance broker Crombie Lockwood was preparing to launch a new product, Onesurance, comprising home, contents, vehicle and landlord insurance.
With new pricing and provisioning, Crombie Lockwood wanted to be sure they could closely monitor the performance of Onesurance, so they approached Stellar for help in designing a suitable report pack for three audiences: Branch Managers, Executives and the Board.
“Historically, Crombie Lockwood had used Excel or other tools to report at a very high level on results, but we wanted to move to a more detailed view of the history, and expose opportunities for growth and learning in our branches,” says John Chandler, Executive, Monument Insurance. (Monument is a wholesale underwriting agency and part of the Crombie Lockwood Group.)
As Onesurance was being launched, a variety of reports evolved to meet the needs of the business, but these had differing formats and objectives.
“The reports contained all the measures suggested by the external service provider that helped set up the new product,” says Stellar consultant Jürgen Backhaus. “There were so many metrics that it was going to be challenging to present them in a clear and meaningful way for the intended users.”
Finding value in data
Stellar met with Crombie Lockwood executives to understand their priorities, design guidelines and high-level requirements.
“We were looking for two things,” says John. “We wanted Stellar to help construct the dashboards and also transfer knowledge about how to maintain them and build them in the future so we could in-source modifications and some future effort.”
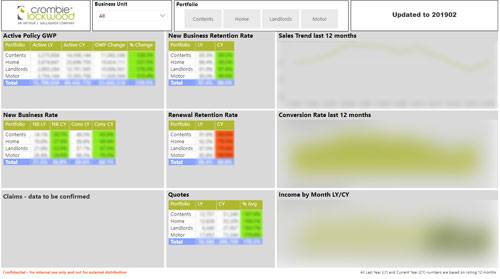
Stellar’s consultants recommended prototyping the new reports and dashboards with Microsoft Power BI, one of the most powerful and user-friendly business analytics tools available. We proposed just three Power BI dashboards (one for each of the three user groups) with a total of five reports.
Working with staff at Crombie Lockwood, Stellar’s analytics experts refined the designs before handing over the completed reports and dashboards.
In fact, the final designs were more than just concepts – they were built with actual data extracted from the legacy spreadsheets. This meant that the analytics team at Crombie Lockwood simply needed to update the source data connection in order to have actual working Power BI dashboards.
Above and beyond
As a client-focused business, John says Branch Directors are now able to clearly see where customers are potentially unaware of product benefits, and target the opportunity for conversation for each of the individual brokers. As a by-product of the reporting, Branch Directors now also lead conversations about relationship-building techniques that drive client needs analysis across their teams.
“This sets up a clear opportunity for the teams to learn from each other in a targeted manner about relationship techniques and approaches. Historically, this may have not been visible, we can now identify these monthly and the dashboard enables clear visibility and management of our clients’ potential needs.
“I think the surprise for the branches was the ability to create the dashboards and then drill through into the data. We can modify the components of the dashboard to suit the audience (for example we have cascading views from top down, drilling right through) and we think this will drive a conversation about what’s possible with Power BI as we keep learning.”
Stellar designed the dashboards using customer-specific colours, headers and footers – creating a library of templates that can easily be adapted for additional Power BI reporting beyond the Onesurance product.
This turned out to be an important piece of added value, says Jürgen. “Before our engagement, Crombie Lockwood did not plan to use Power BI company-wide; however, the parent group (Gallagher) was in the process of designing a roll-out plan for Power BI. With some advice and assistance from Stellar, Crombie Lockwood was able to use their existing Microsoft SQL Server licensing to set up an internal Power BI Reporting Server.”
As a result, Crombie Lockwood can use most online features of Power BI without needing to purchase additional licences, and can distribute Power BI reports inside the company without requiring a desktop client installation.
“Stellar did an excellent job of understanding our requirements up front and capturing those, as well as working to refine as we went,” says John. “We did make minor modifications along the way as we learned more, but they were always willing to evolve as we went.”
Dashboards are currently being rolled out across the Crombie Lockwood network, with positive feedback coming in.
Craig Larmer, consulting director at Stellar, says the Crombie Lockwood project is a good example of how Stellar can complement an existing internal BI team and not only deliver the stated project goals but additional benefits through rapid prototyping.