 By Camila Ellis, Lead Consultant at Stellar
When you think about it, all data visualisation tools provide similar functionality, and very often it’s hard to fully understand what makes them unique (apart from licensing and commercial aspects).
The Gartner Magic Quadrant for Analytics and BI Platforms has become the first place to look when trying to understand the strengths of the many products available.
In the 2018 edition there are just three technology providers in the Leaders quadrant: Microsoft, Tableau and Qlik, which is the one I’d like to highlight today.
What’s different about Qlik Sense?
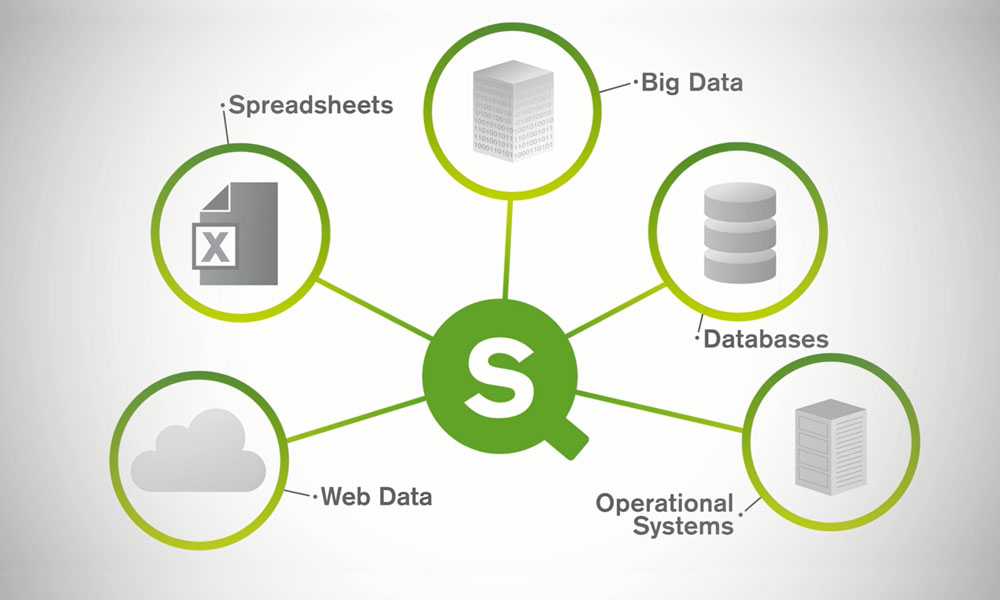
When you talk with a Qlik expert, you’re likely to start hearing about the associative engine. This engine is designed specifically for interactive, free-form exploration and analysis. All data is brought together and fully indexed to find all possible associations in the data, across all your data sources.
The associative engine lets users visually understand relationships between data and, maybe even more importantly, to see where there are, in fact, no associations.
For example, imagine a Sales Manager looking at a dashboard trying to understand regional sales performance. In a typical query-based tool they would see where sales are happening. The associative model, however, helps the sales manager understand what products are not popular in certain segments. And the manager can do this by simply navigating within the dashboard, without having to request help from a data expert who knows SQL and understands outer joins, etc.
This is really powerful, as it opens the door to fast thinking, and identifying fresh business opportunities.
On the visualisation side, navigation in Qlik Sense is very user-friendly. Visualisations are refreshed immediately upon applying filters, providing an instant response to your selection – just as quickly as you can think.
I really like Qlik’s approach to serving customers. Seeing is Believing (SiB) is how Qlik describes its approach to helping business understand their own data, solve a business problem, find an opportunity or mitigate a risk. It’s a Proof of Concept approach, where customers get to trial Qlik Sense using their own data.
About Qlik
Qlik was founded in Lund, Sweden in 1993 and is now headquartered in Pennsylvania.
The company has 40,000 customers and 1700 partners (including Stellar Consulting Group) in more than 100 countries.
Qlik and Stellar
If your organisation is looking to make better use of data and to exploit the power of insights, technology is just one component.
Successfully implementing Qlik Sense, or any other tool, requires orchestrating all the different components of the data and analytics landscape. Very often the focus stays with technology, but having the right governance and strategic intent will drive and support the cultural shift needed to embed use of the new technology and build data literacy.
Also essential are well-designed processes and a clear operating model to help individuals understand their roles and responsibilities.
As New Zealand’s leading, independent data analytics consultancy, Stellar has developed a unique framework known as the 7 Essentials of BI Success. We use it to make sure we cover all the bases to ensure long-term success. The framework draws on our deep, real-world experience in designing, implementing and supporting Business Intelligence solutions, and helps to bring focus to the often-overlooked people and process factors that are so critical to on-going success.
To find out more, please get in touch with Stellar.